Negative sentiment has dominated the market this week as Ethereum failed to reclaim the $2000 level. The bears are attempting to pull the price back below the breakout level and trap the bulls.
ການວິເຄາະດ້ານວິຊາການ
by: Grizzly
ຕາຕະລາງປະຈໍາວັນ
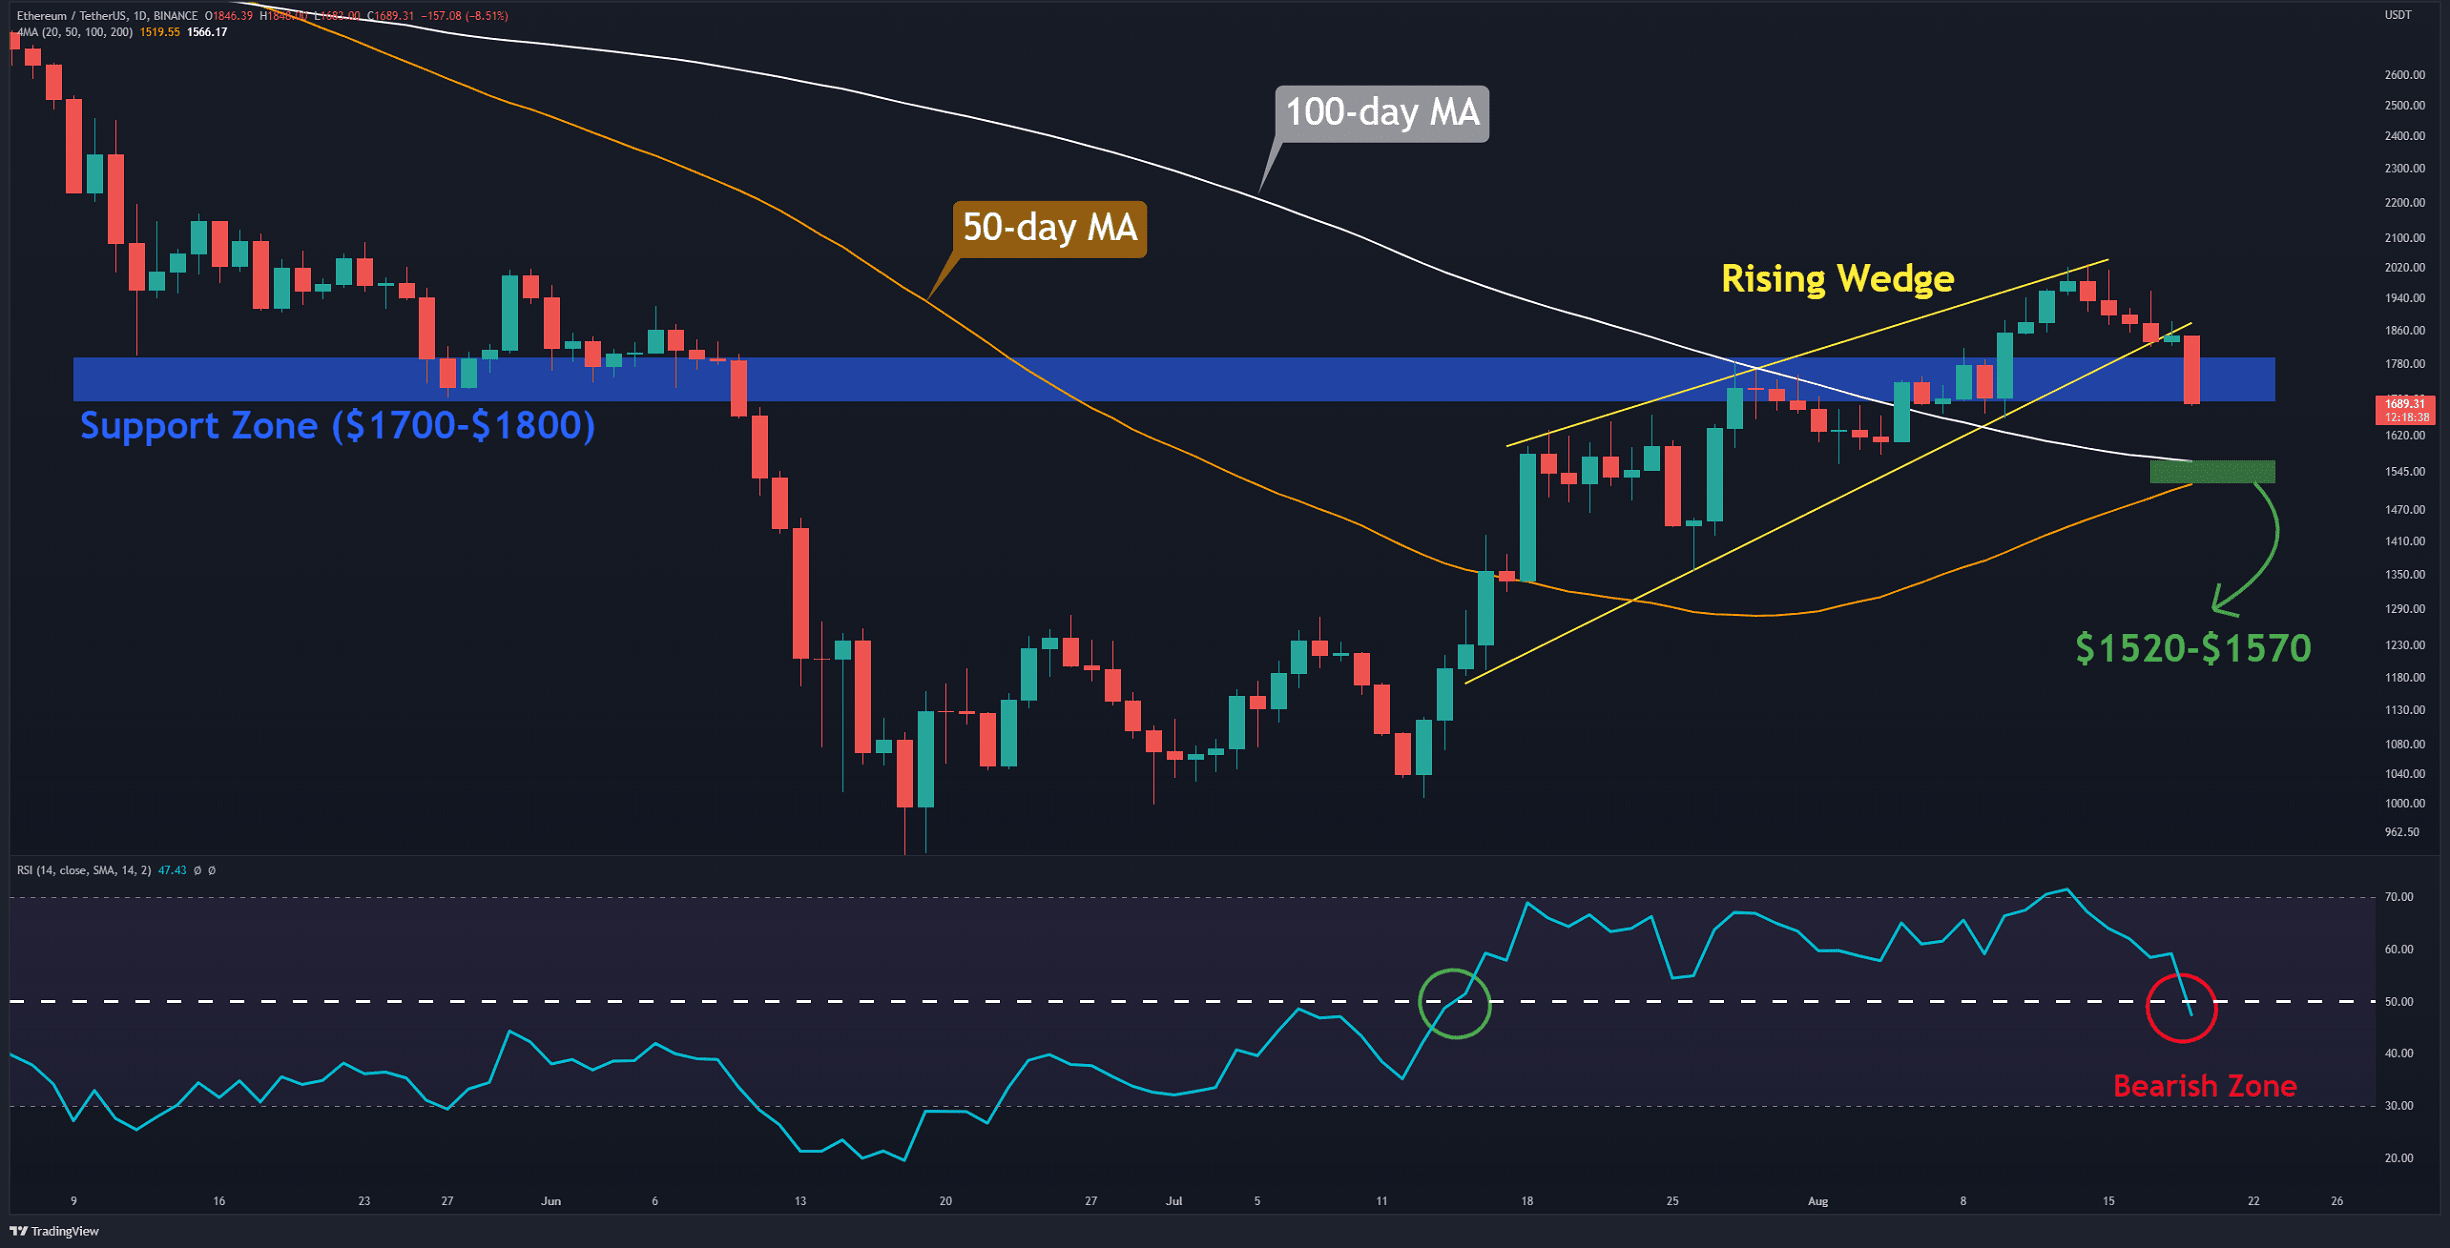
The bears stepped in to induce a 16% decline over the past six days after Ethereum was rejected from $2,000. Consequently, the appearance of the rising wedge pattern (in yellow) could be a signal that the bearish trend might extend. The bulls must prevent a decline below the critical level in the $1,700-$1,800 range.
The Relative Strength Index (RSI) indicator has also slipped below the baseline, which suggests that the bears dominate the momentum.
If the pair continues to decline, the closest support will be found in the range of $1520-$1570 (in green). This support is the result of the intersaction between the 50-day moving average line(in orange) and the 100-day (in white) moving average line. If this level cracks, the possibility of forming a bear structure would be strengthened, thereby sending Ethereum to test $1,280. The bulls have no choice but to hold the price above $1,700 to resume the bullish trend.

ລະດັບສະ ໜັບ ສະ ໜູນ ຫຼັກ: $ 1700 & $ 1500
ລະດັບການຕໍ່ຕ້ານທີ່ ສຳ ຄັນ: $ 2000 & $ 2200
ສະເລ່ຍການເຄື່ອນຍ້າຍປະຈໍາວັນ:
MA20: $1777
MA50: $1519
MA100: $156
MA200: $2237
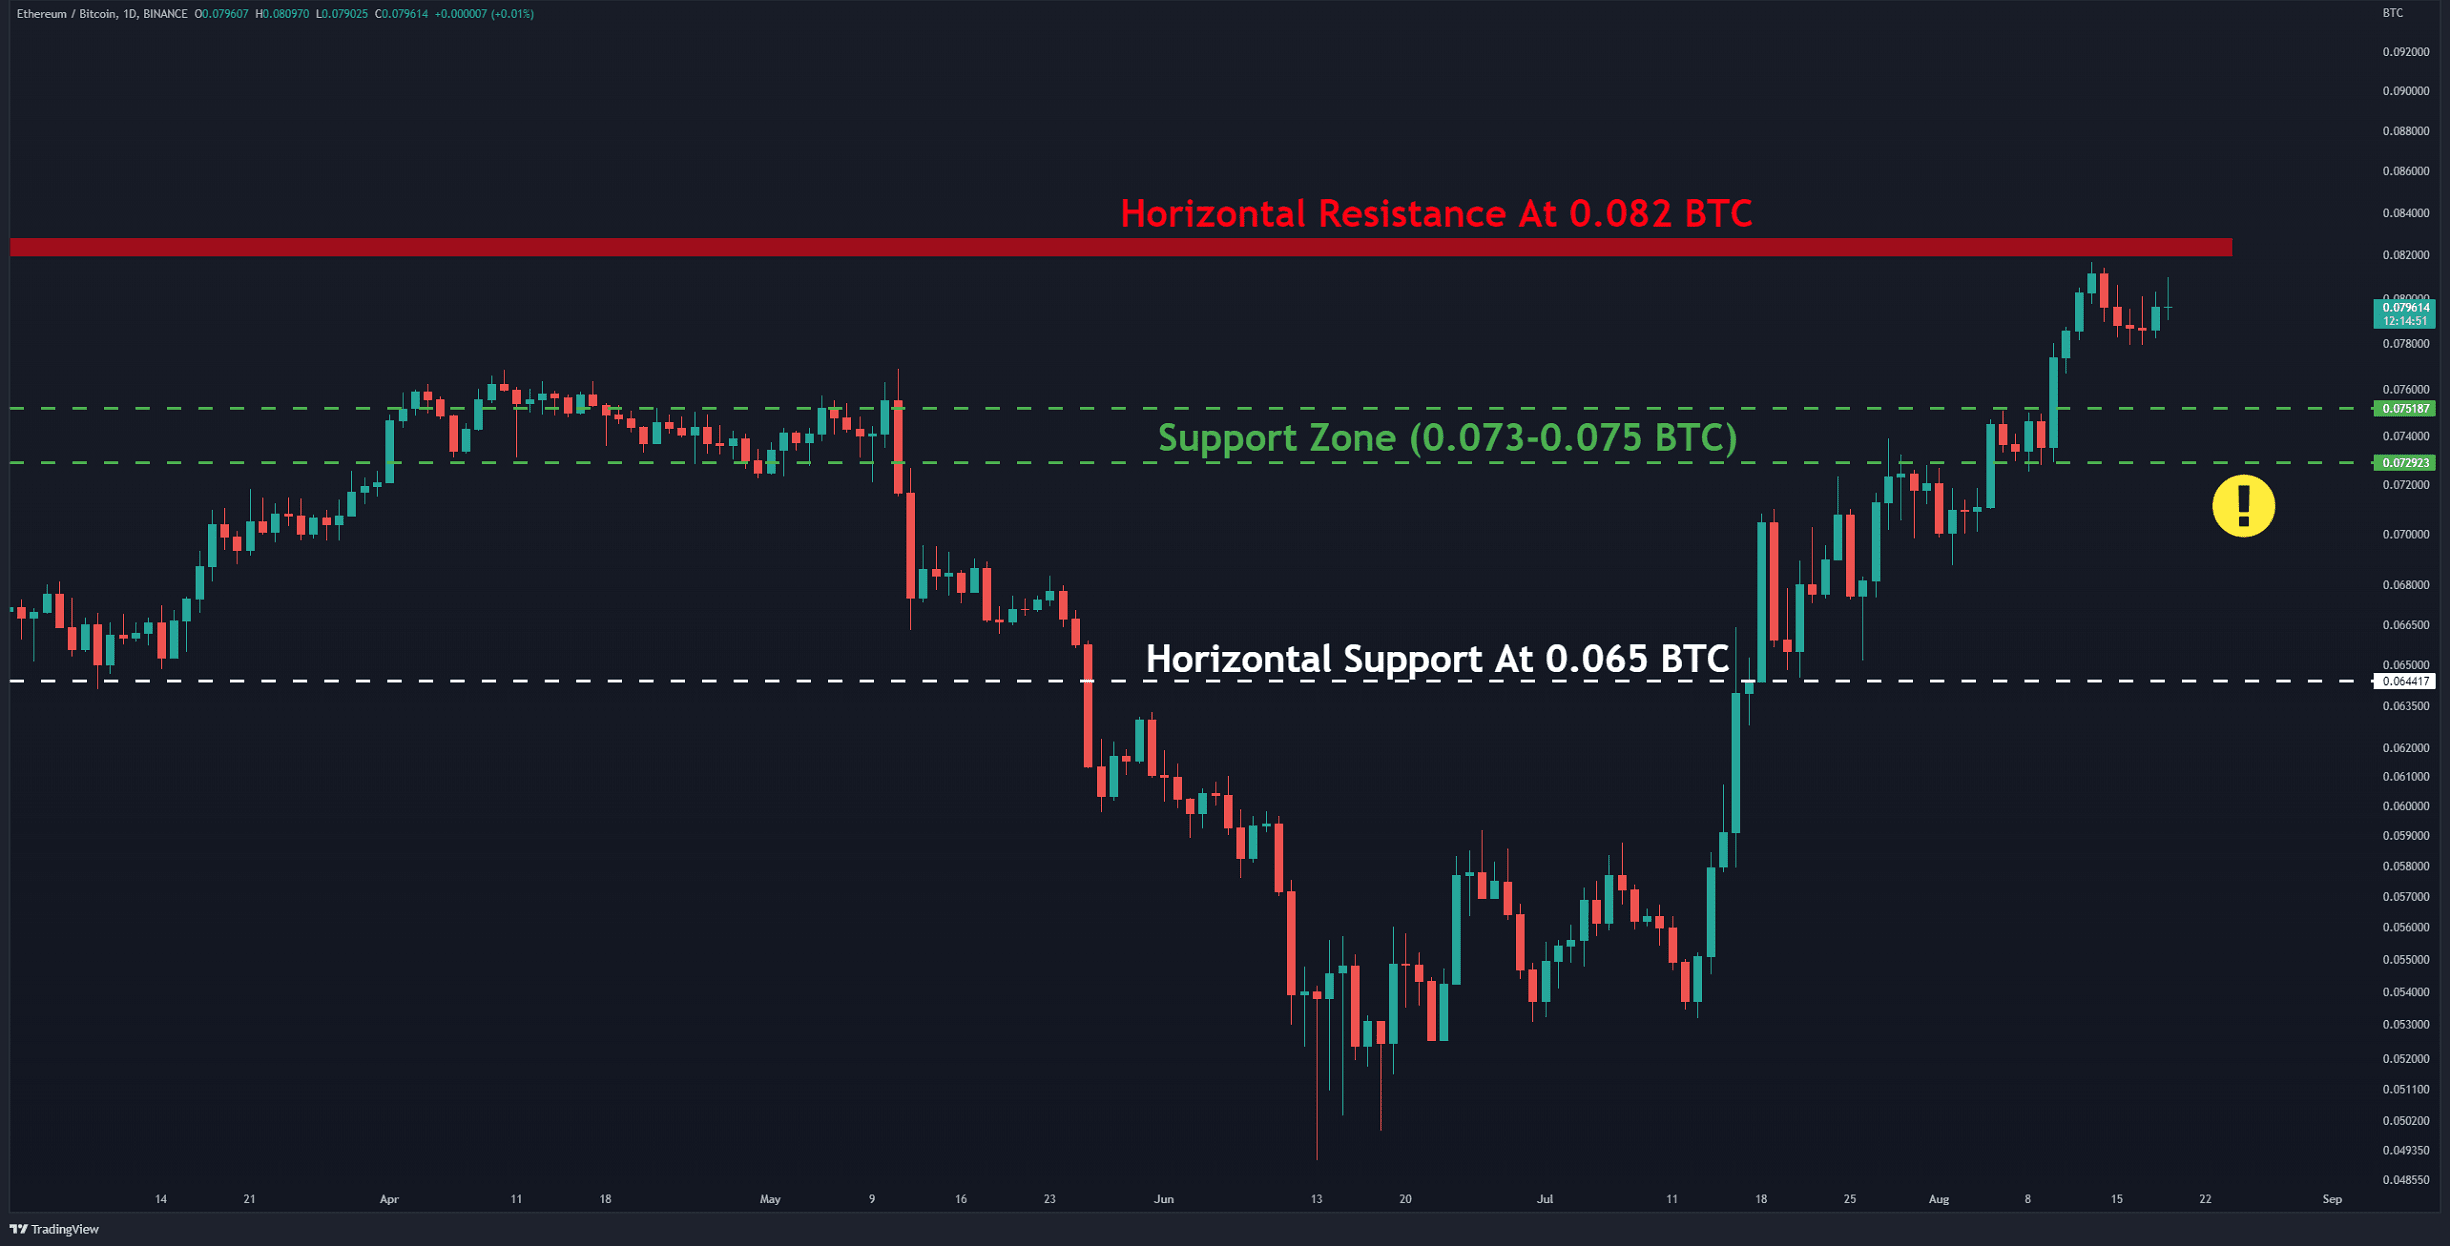
ຕາຕະລາງ ETH/BTC
Against Bitcoin, the situation is slightly different. Although the bulls failed to push the price above the horizontal resistance at 0.082 BTC (in red), they still control the market. A break and close below the support zone at 0.073-0.075 BTC (in green) would signal the start of a bearish rally with a target of approximately 0.065 BTC (in white).
ລະດັບສະ ໜັບ ສະ ໜູນ ຫຼັກ: 0.0.75 & 0.065 BTC
ລະດັບການຕໍ່ຕ້ານທີ່ ສຳ ຄັນ: 0.082 & 0.088 BTC
ການວິເຄາະຄວາມຮູ້ສຶກ
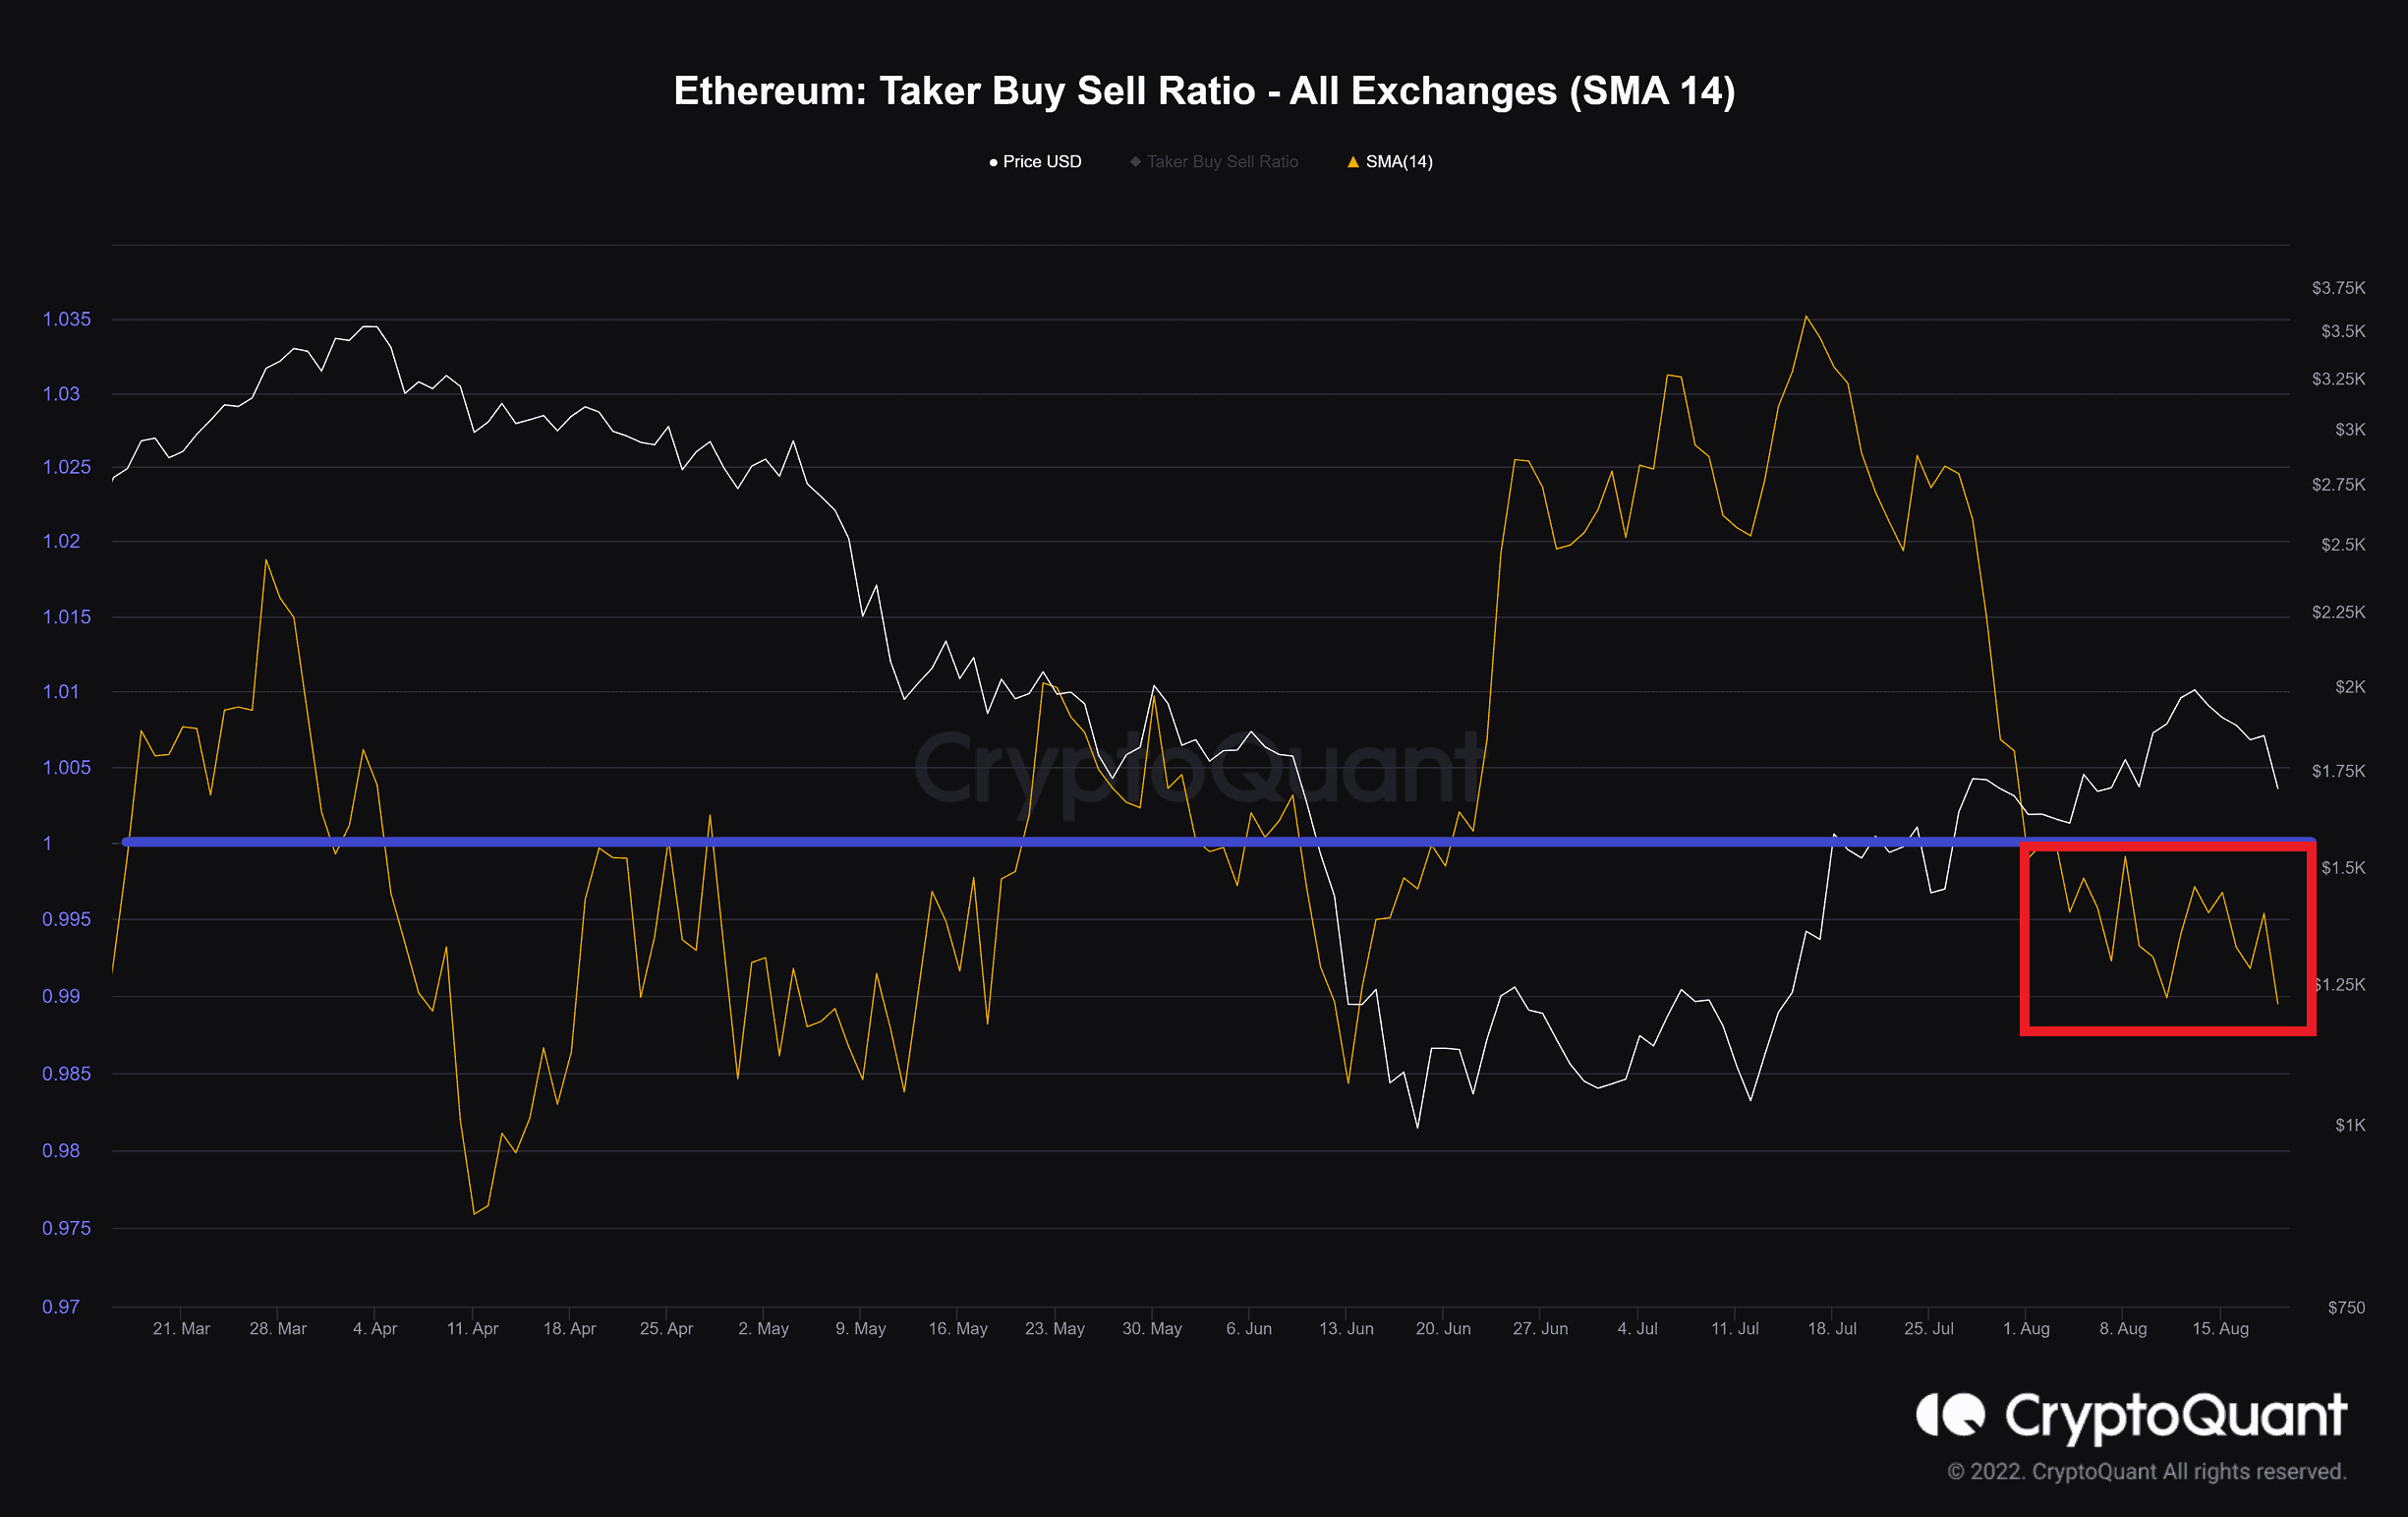
Taker Buy Sell Ratio (SMA14)
ຄວາມຫມາຍ: The ratio of buying volume divided by selling volume of takers in perpetual swap trades.
Values over 1 indicate that the bullish sentiment is dominant.
Values under 1 indicate that the bearish sentiment is dominant.
As mentioned in our previous analysis, some investors preferred to book their profits when the price reached the technical resistance levels. Also, more sell orders have been filled by takers in the derivative market, which shows that the bearish sentiment prevails. As a result, the metric drops below line 1 (in blue). As long as this metric does not return above it, the chances of a considerable recovery remain slim.
Binance ຟຣີ $100 (ສະເພາະ): ໃຊ້ລິ້ງນີ້ ເພື່ອລົງທະບຽນ ແລະຮັບ $100 ຟຣີ ແລະຄ່າທຳນຽມສ່ວນຫຼຸດ 10% ໃນ Binance Futures ໃນເດືອນທຳອິດ (ຂໍ້ກໍານົດ).
ຂໍ້ສະ ເໜີ ພິເສດ PrimeXBT: ໃຊ້ລິ້ງນີ້ ເພື່ອລົງທະບຽນ ແລະໃສ່ລະຫັດ POTATO50 ເພື່ອຮັບສູງເຖິງ $7,000 ໃນເງິນຝາກຂອງທ່ານ.
ການປະຕິເສດ: ຂໍ້ມູນທີ່ພົບໃນ CryptoPotato ແມ່ນບັນດານັກຂຽນທີ່ອ້າງອີງ. ມັນບໍ່ໄດ້ສະແດງຄວາມຄິດເຫັນຂອງ CryptoPotato ກ່ຽວກັບວ່າຈະຊື້, ຂາຍ, ຫລືຖືການລົງທືນໃດໆ. ທ່ານໄດ້ຖືກແນະ ນຳ ໃຫ້ເຮັດການຄົ້ນຄວ້າຂອງທ່ານເອງກ່ອນທີ່ຈະຕັດສິນໃຈລົງທຶນໃດໆ. ໃຊ້ຂໍ້ມູນທີ່ສະ ໜອງ ໃຫ້ໃນຄວາມສ່ຽງຂອງທ່ານເອງ. ເບິ່ງປະຕິເສດ ສຳ ລັບຂໍ້ມູນເພີ່ມເຕີມ.
ຕາຕະລາງ Cryptocurrency ໂດຍ TradingView.
Source: https://cryptopotato.com/ethereum-crashes-9-in-a-day-wheres-the-next-support-eth-price-analysis/