- Dogecoin (DOGE) can be seen currently moving in a sideways trend.
- RSI indicator at the current moment is generating a sell signal.
- The prices of the coin may be seen rising after a consolidation zone or trendline breakout.
The technical analysts might have observed that the price of the coin is currently fluctuating between $0.097 and $0.070. The coin has tried multiple times to break this range on the upside but was unsuccessful in doing so. Therefore, if a breakout of this range occurs this time, the investors may witness a bull surge. After the tweet by Elon musk, now there are chances for DOGE to form a solid bullish rally, breaking all resistances spanning over a few weeks.
Monoscopic View
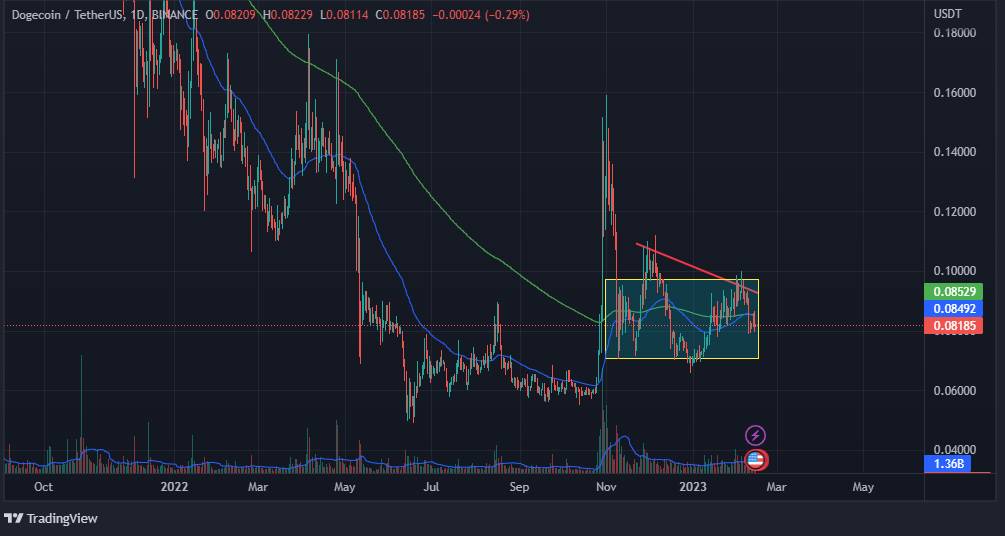
On the daily chart, apart from the range marked, investors can also see the trendline (red line) being drawn. It is clearly visible that the coin has tried to break this trendline and go upwards, but was unsuccessful. Therefore, this trendline breakout may serve as an additional confirmation to the bull rally. Moreover, the coin previously moving sideways for a long time gave a breakout of one of its strong resistance levels i.e. $0.08219 and after which the price rose up to $0.15162.
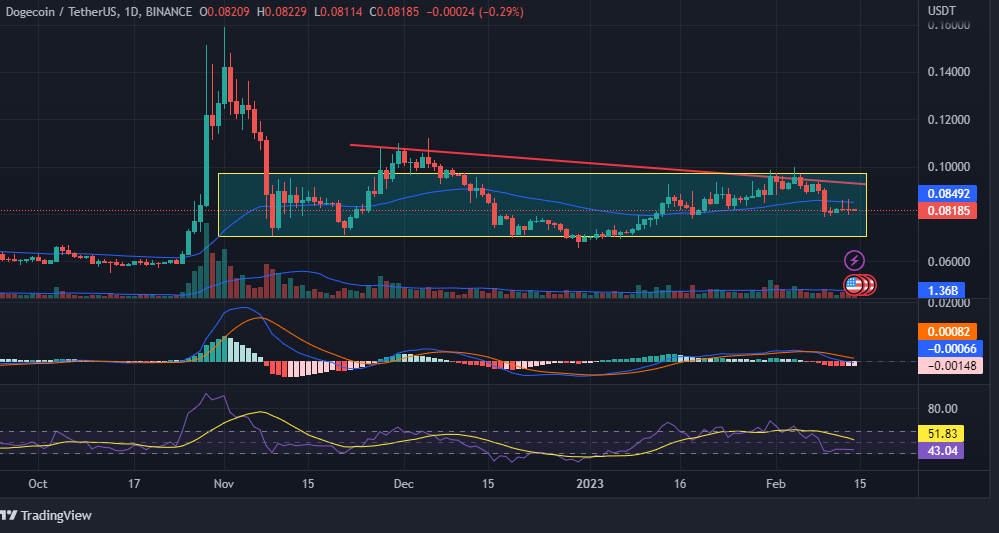
The MACD indicator has shown a bearish crossover, indicating that the bulls are now under the control of the bears. The histograms of the MACD are turning light red, which implies that this crossover is weakening, and forming a possibility of a bullish crossover. The RSI curve, on the other hand, is currently trading below its 50-point mark at 43.04. Overall, it can be said that the MACD indicator is neutral, while a sell signal is being delivered by the RSI indicator.

ກ້ອງຈຸລະທັດ
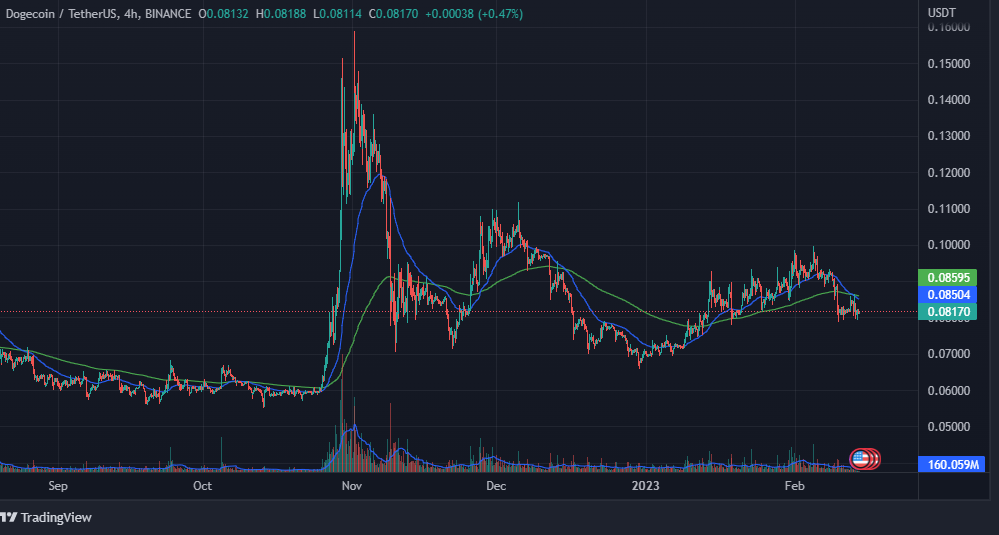
On the short-term chart, the investors can see a Death Crossover, which suggests that the prices may drop in the near future. Furthermore, at current levels, the coin’s prices can be seen consolidating. As a result, depending on the breakdown or breakout of the consolidation zone, investors may witness a bearish or bullish move in the future.
What after consolidation?
After the consolidating phase, DOGE can rise taking support of the various support zones. If prices break out of the resistance of $0.100, it may establish a high run targeting for the $0.1500. This rally can test higher resistances and even aim for the all time high.
ສະຫຼຸບ
Investors might have come to the conclusion that the coin may consolidate at present price levels for some time before initiating a bull move after examining the daily and short-term charts. Additionally, a Death Crossover on the short-term chart raises the possibility of a downfall in prices.
ລະດັບເຕັກນິກ
ລະດັບການຕໍ່ຕ້ານ – $0.09728 ແລະ $0.10582
ລະດັບສະຫນັບສະຫນູນ - $ 0.07078 ແລະ $ 0.05720
ປະຕິເສດ: ທັດສະນະແລະຄວາມຄິດເຫັນທີ່ຂຽນໂດຍຜູ້ຂຽນ, ຫຼືຄົນທີ່ມີຊື່ໃນບົດຄວາມນີ້, ແມ່ນສໍາລັບຈຸດປະສົງຂໍ້ມູນເທົ່ານັ້ນ, ແລະພວກເຂົາບໍ່ໄດ້ສ້າງຕັ້ງທາງດ້ານການເງິນ, ການລົງທຶນ, ຫຼືຄໍາແນະນໍາອື່ນໆ. ການລົງທຶນໃນຫຼືການຊື້ຂາຍຊັບສິນ crypto ມາພ້ອມກັບຄວາມສ່ຽງຂອງການສູນເສຍທາງດ້ານການເງິນ.
Andrew ເປັນນັກພັດທະນາ blockchain ຜູ້ທີ່ພັດທະນາຄວາມສົນໃຈຂອງລາວໃນ cryptocurrencies ໃນຂະນະທີ່ລາວຮຽນຈົບ. ລາວເປັນນັກສັງເກດການຢ່າງກະຕືລືລົ້ນໃນລາຍລະອຽດແລະແບ່ງປັນຄວາມມັກຂອງລາວໃນການຂຽນພ້ອມກັບການເປັນນັກພັດທະນາ. ຄວາມຮູ້ດ້ານຫລັງຂອງລາວກ່ຽວກັບ blockchain ຊ່ວຍໃຫ້ລາວມີທັດສະນະທີ່ເປັນເອກະລັກໃນການຂຽນຂອງລາວ
Source: https://www.thecoinrepublic.com/2023/02/18/doge-technical-analysis-will-coin-beat-bears-for-a-bullish-move/