ລາຄາ Ethereum analysis is bearish as selling pressure has built from the bearish side. The market followed the bullish trend for the last few hours today, and the coin gained significant value during that time, but a correction was due for continuing further upside later on. The conditions have changed as the bears have resisted further up moves now, and the crypto pair has started a correction. Resistance for the move up was seen at $1,229, and the pair is currently seeking support just below the $1,209 level.
The market started the day with a bullish outlook, and the coin was able to touch a high of $1,229 but failed to sustain the move. The bears have now taken control of the market, and ETH/USD is trading at $1,210 as of now. The market’s current outlook looks bearish, and a further drop in the price is expected if the support at $1,209 fails to hold.
On the upside, if the bulls can defend the $1,209 support level, then ETH/USD may resume the upside trend and try to break the resistance at $1,229. The next significant resistance level is seen at $1,241.
ETH/USD ຕາຕະລາງລາຄາ 1 ມື້: ລະດັບລາຄາຫຼຸດລົງເປັນ $1,210
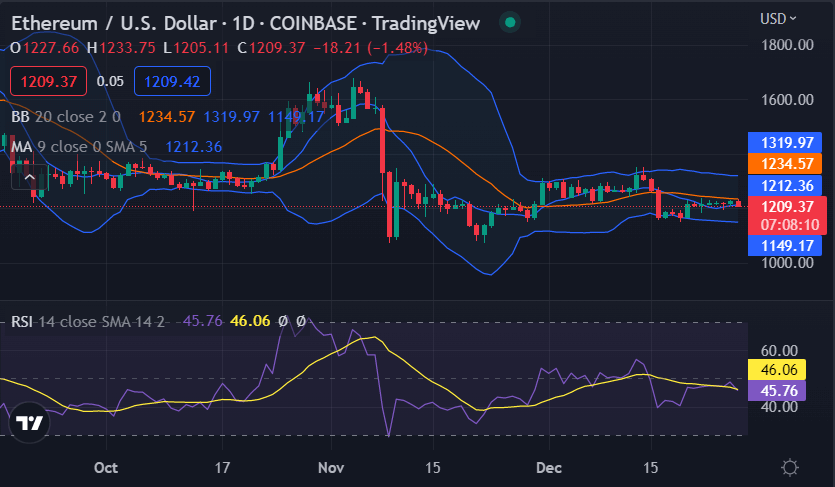
ຕາຕະລາງລາຄາ 1 ມື້ສໍາລັບ Ethereum price analysis shows bears are defining the price curve today. The ETH/USD is correcting after the bullish recovery of earlier today, the selling pressure has returned, and the trend is the same as the bears are defining the price function by bringing the price down. ETH/USD pair is trading hands at $1,210 at the time of writing. The price is down by almost 0.39% on the day as the market is correcting from here. The 24-hour volume traded in the market is $3.90 billion, and the market cap for the coin stands at $148 billion.

The moving average (MA) is standing at $1,212, and the ETH price is trading well below it. The Relative Strength Index (RSI) indicator is at 46.06 levels with no extremities, which shows that the market is currently indecisive and a breakout is required for further direction. The volatility for the given price chart of ETH/USD is on the lower side as the Bollinger bands are showing a narrow tunnel shape, with the Upper band at $1,319 and the Lower band at $1,149.
Ethereum price analysis 4-hour price chart: Price on downtrend again as bears intervene
ຕາຕະລາງລາຄາ 4 ຊົ່ວໂມງສໍາລັບ ລາຄາ Ethereum analysis shows the bears are maintaining their lead quite impressively, as the price has undergone a decrease today as well. The price is now trading at the $1,210 level and is expected to go down from here soon. The short-term trending line is also moving downwards, which indicates a major bearish sign. The moving average in a 4-hour timeframe is at $1,218, and the ETH/USD pair is trading below it.

The Bollinger Bands on the 4-hour chart have been keeping their average at $1,218, with the Upper band at $1,228 and the Lower band at $1,208. The RSI has fallen near the centerline of the neutral zone at an index of 50.85, but the curve is slowly turning upwards as the buying activity resumes in the market.
ການສະຫລຸບການວິເຄາະລາຄາ Ethereum
Ethereum price analysis shows that the coin is correcting today and may continue to follow a downtrend for today as the broader market is bearish as well, Although the market was on bullish recovery earlier today, the selling pressure is back in control.
ທີ່ມາ: https://www.cryptopolitan.com/ethereum-price-analysis-2022-12-27/
