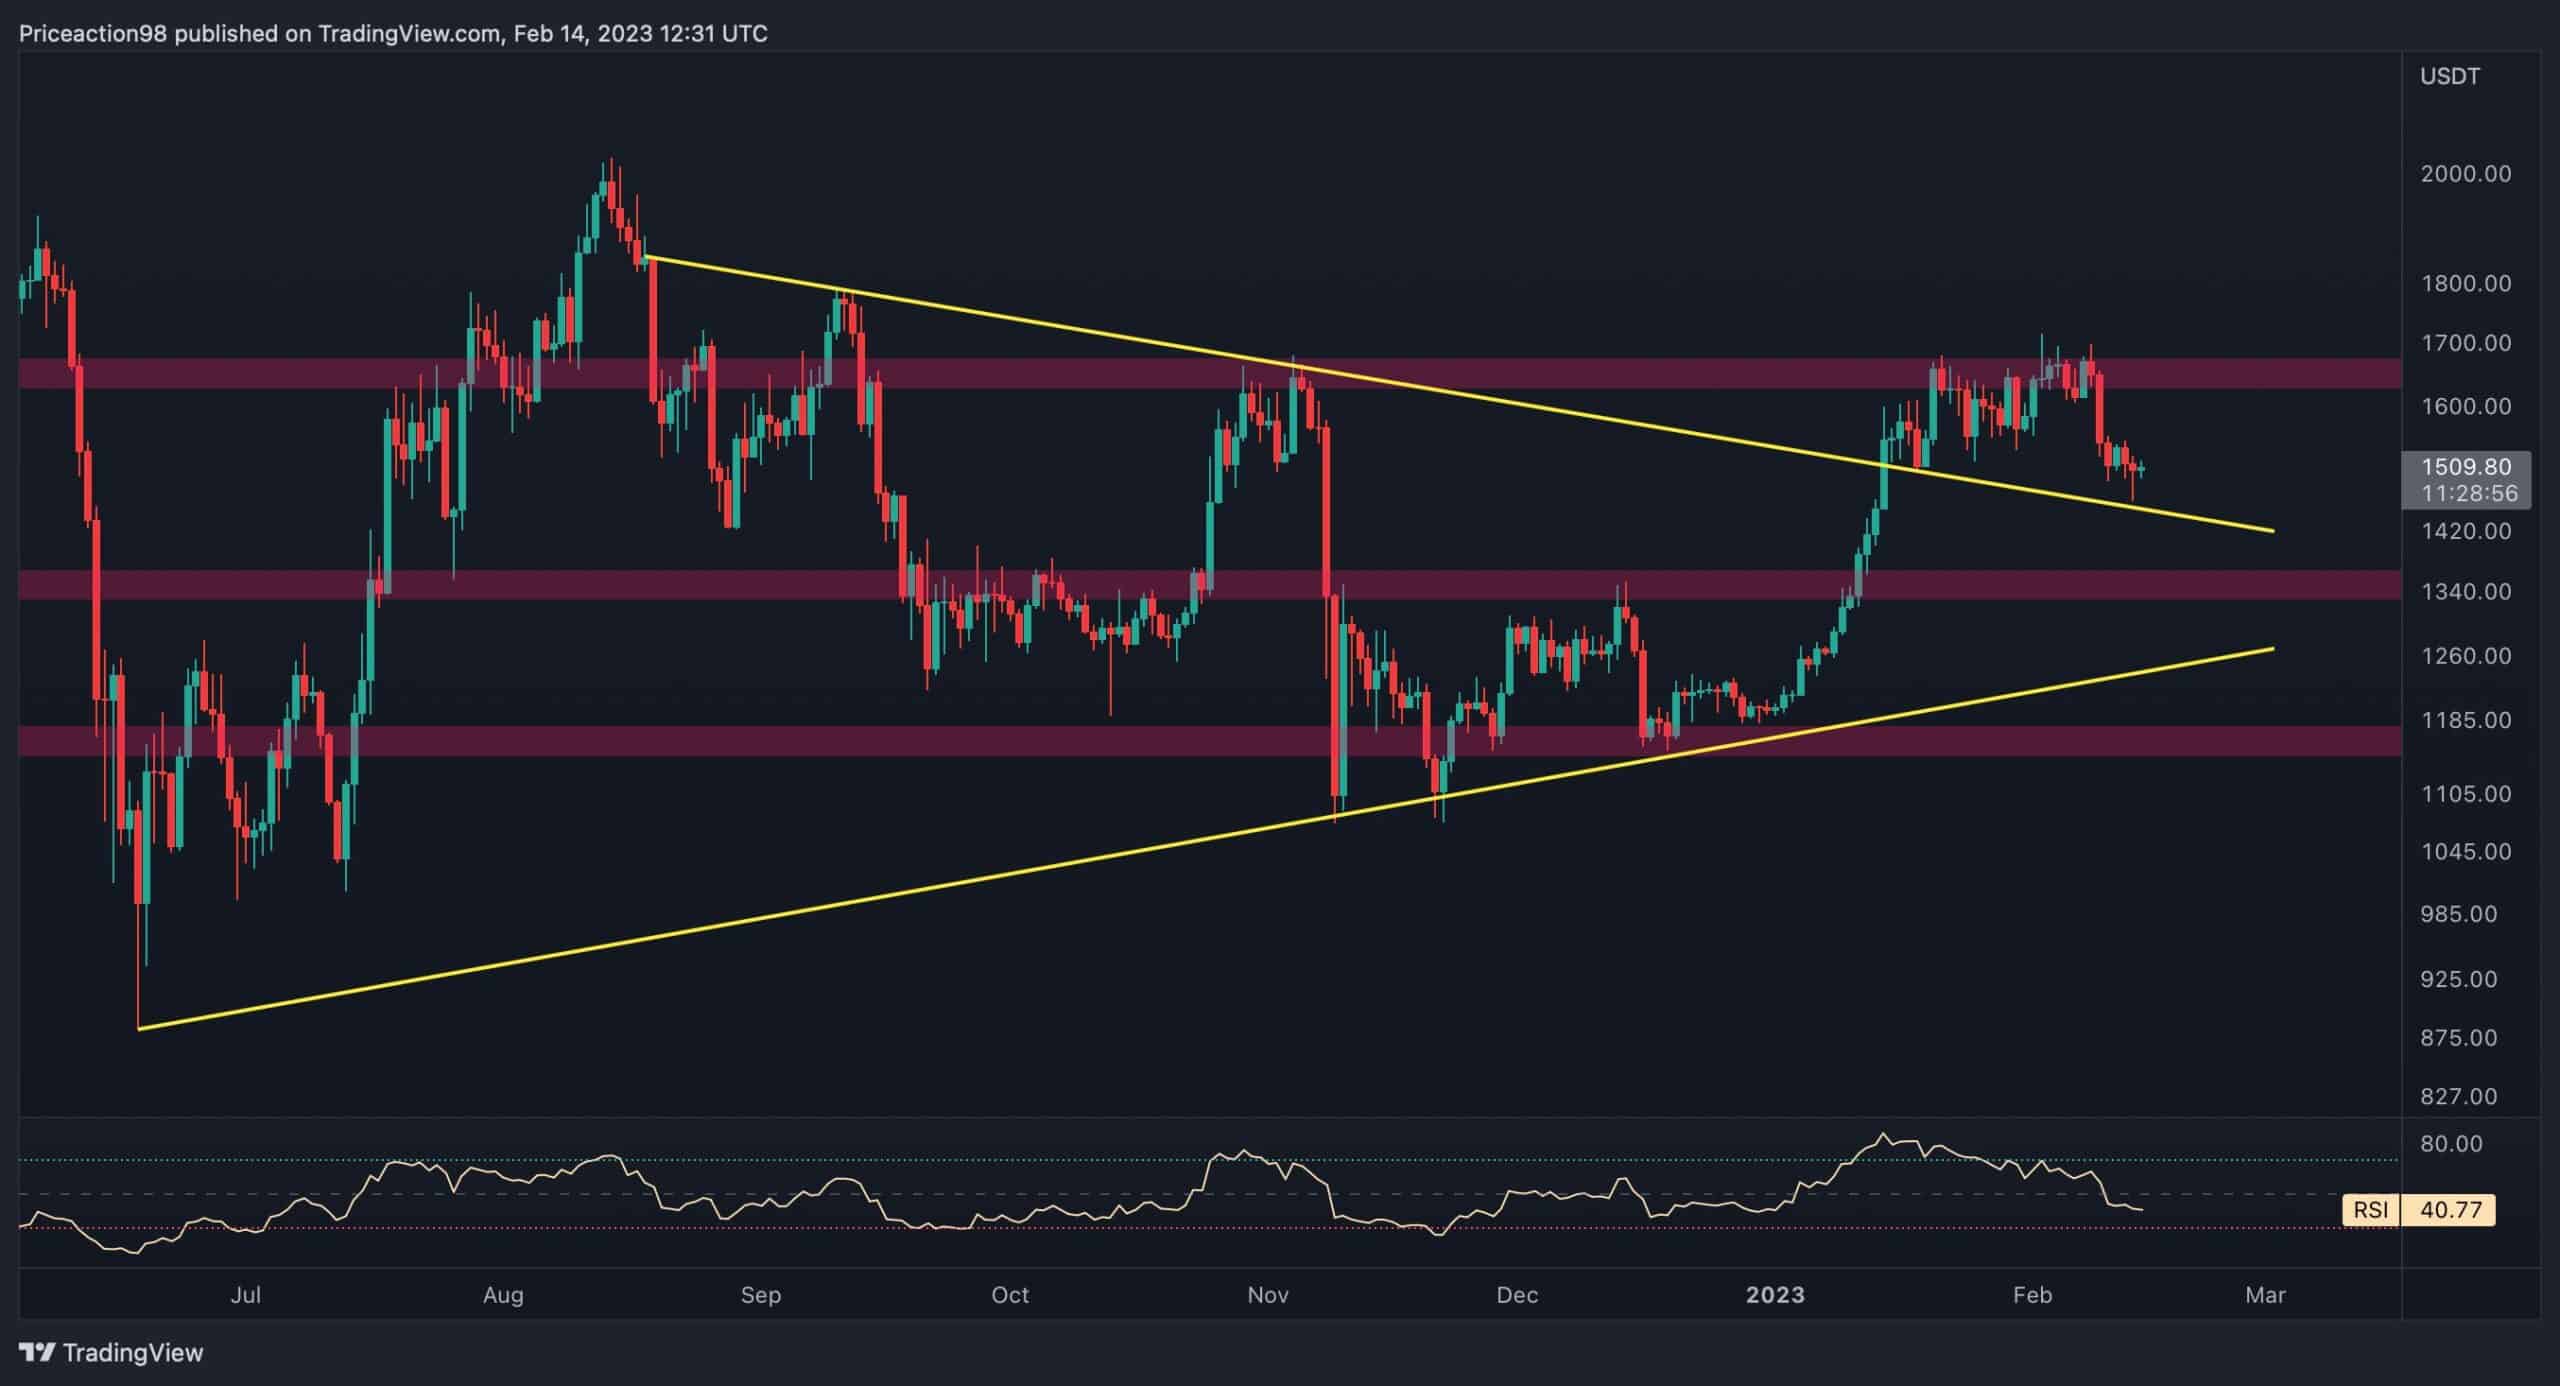
Ethereum’s price appears to have entered a short-term correction phase as the cryptocurrency was recently rejected from a vital resistance zone and plummeted. Nevertheless, two crucial support levels are ahead, which might end the current decline.
ການວິເຄາະດ້ານວິຊາການ
By Shayan
ຕາຕະລາງປະຈໍາວັນ
The price has recently rallied and exited a multi-month symmetrical triangle pattern. However, the momentum has weakened. Following this decline, Ethereum is now facing the triangle’s upper trendline, which acts as a crucial support level.
ETH retesting the upper trendline, standing at $1.5K, might be considered a pullback to the broken level to confirm the breakout and continue surging. If the price drops below the trendline, the $1350 region will be the price’s next stop.

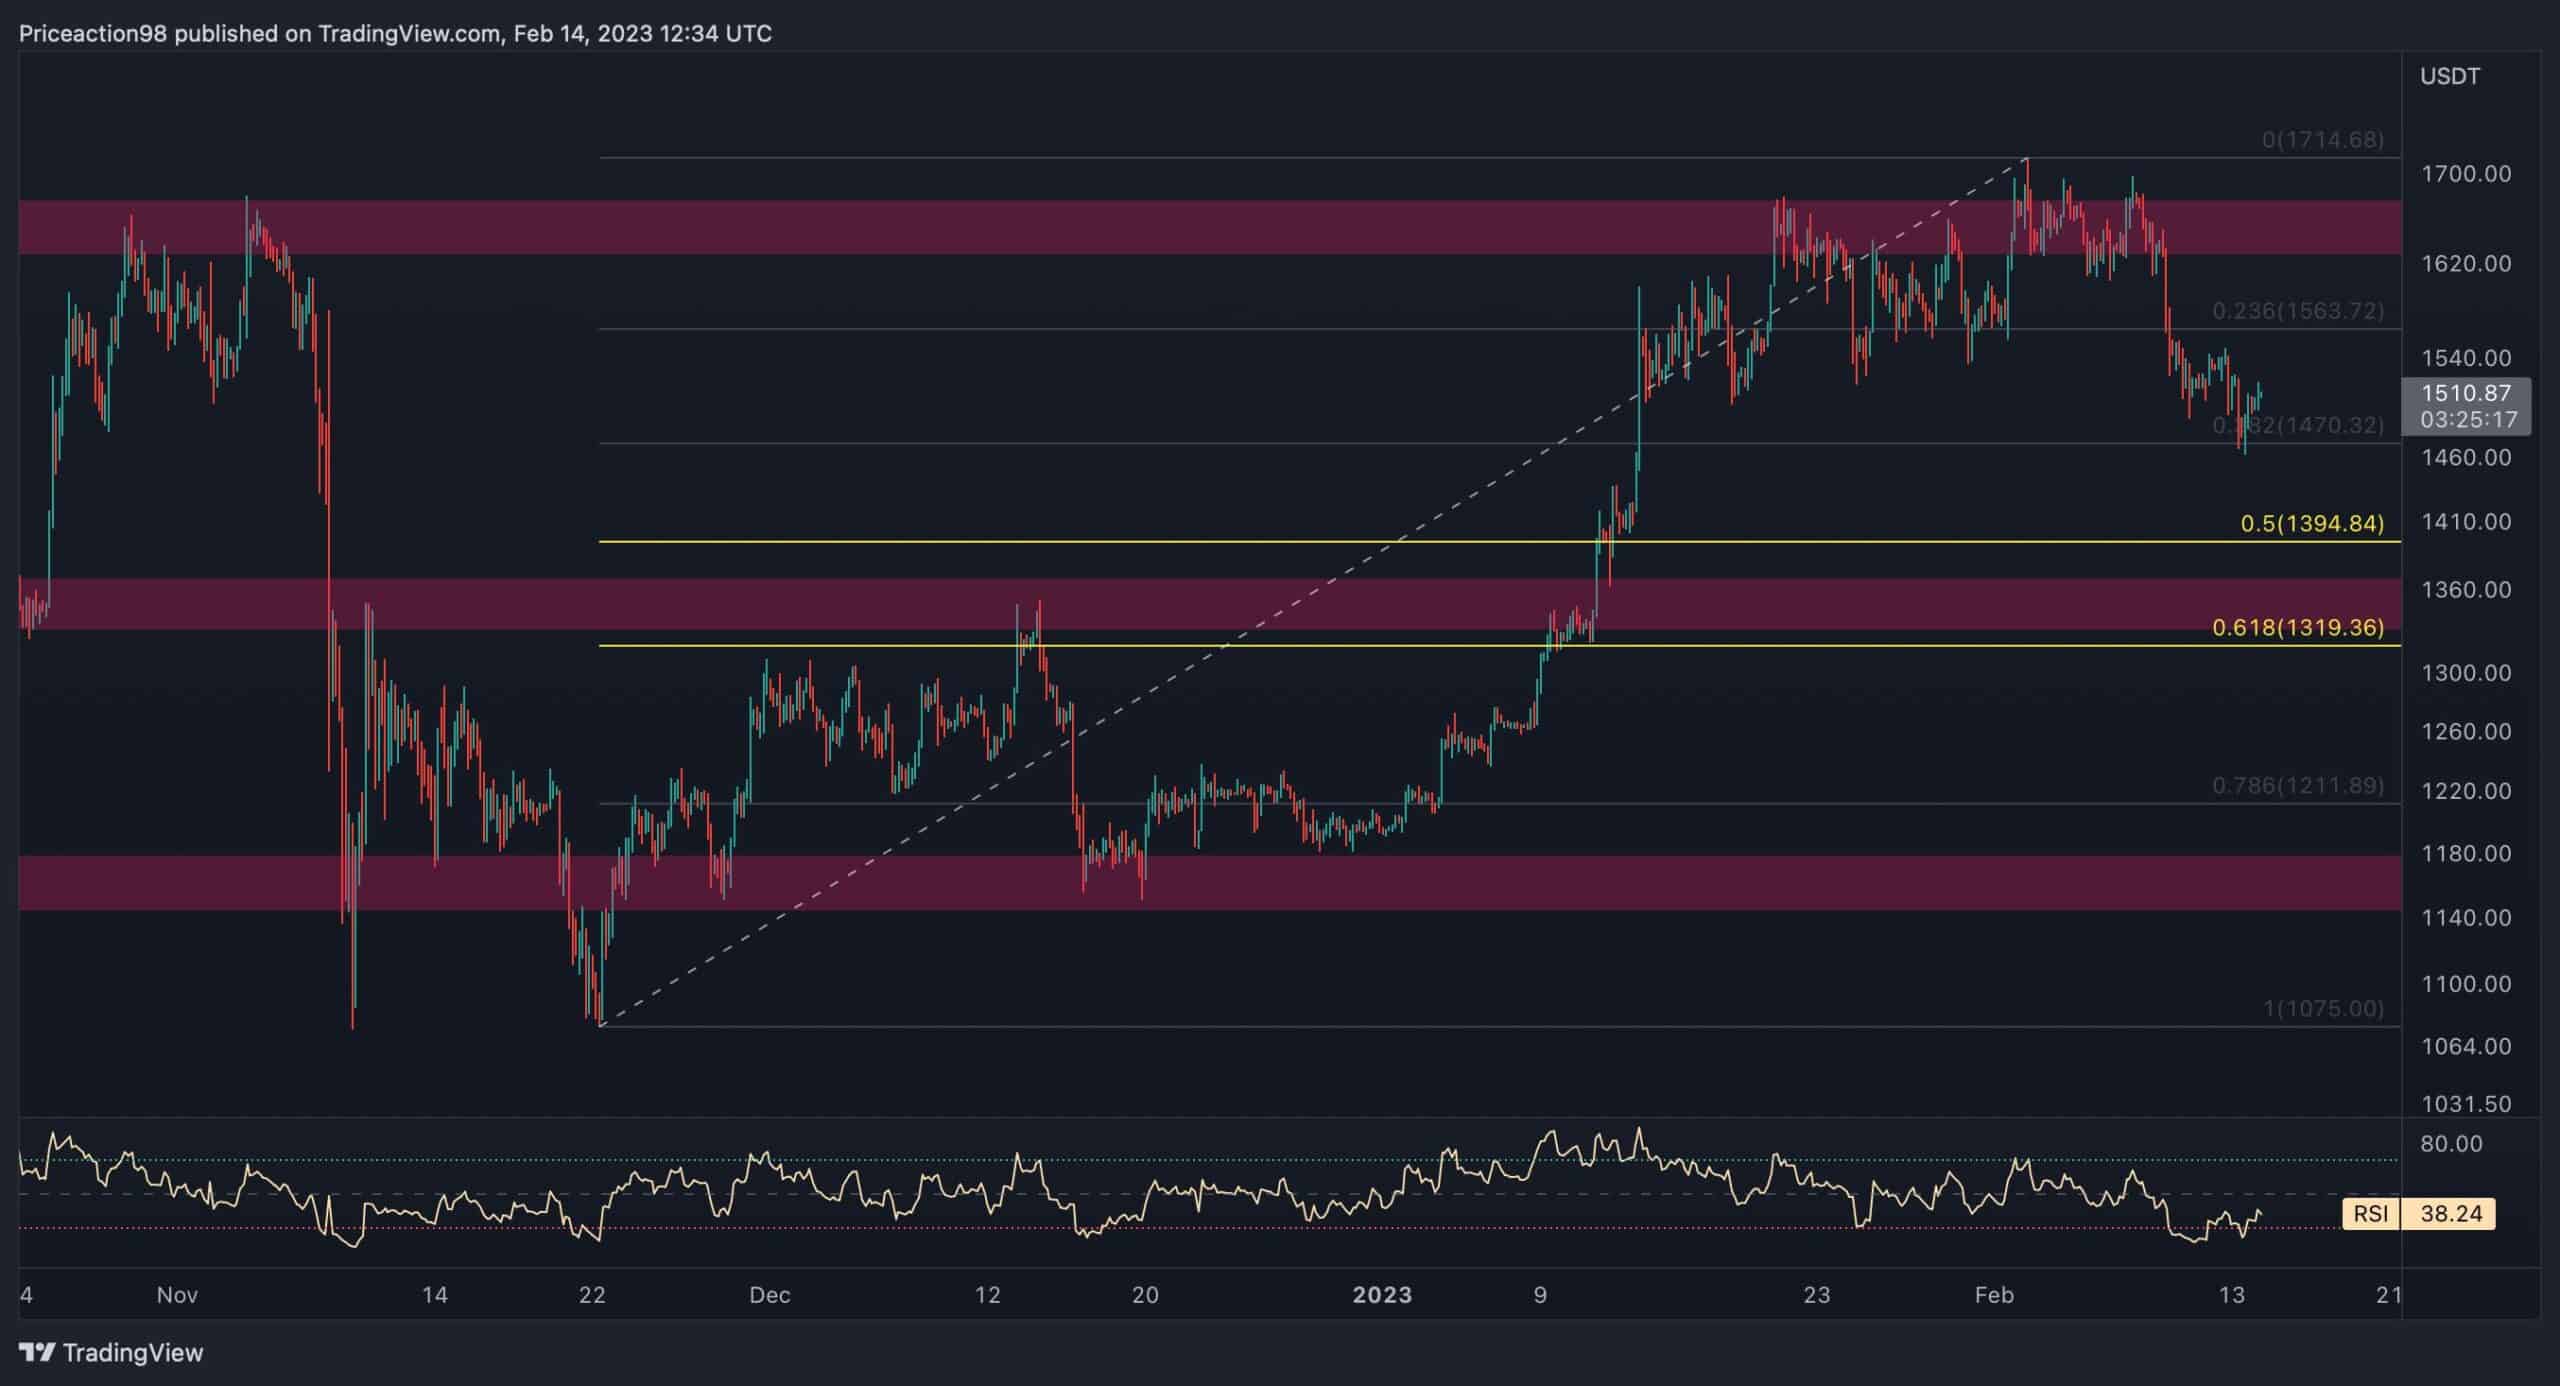
ຕາຕະລາງ 4 ຊົ່ວໂມງ
There are three crucial resistance/support price regions on Ethereum’s chart in the 4-hour timeframe; the $1700 region as resistance, and the $1350 and $1150 zones as supports. The price fluctuates between $1700 and $1350 and could stay inside this range for the short term.
On the other hand, the 0.618($1319) and 0.5($1394) Fibonacci levels of the recent impulsive rally align with the $1350 support region, making it a decisive level to be considered. Therefore, the price seems likely to consolidate toward the $1350 support area and then begin to spike.
ການວິເຄາະລະບົບຕ່ອງໂສ້
By Edris
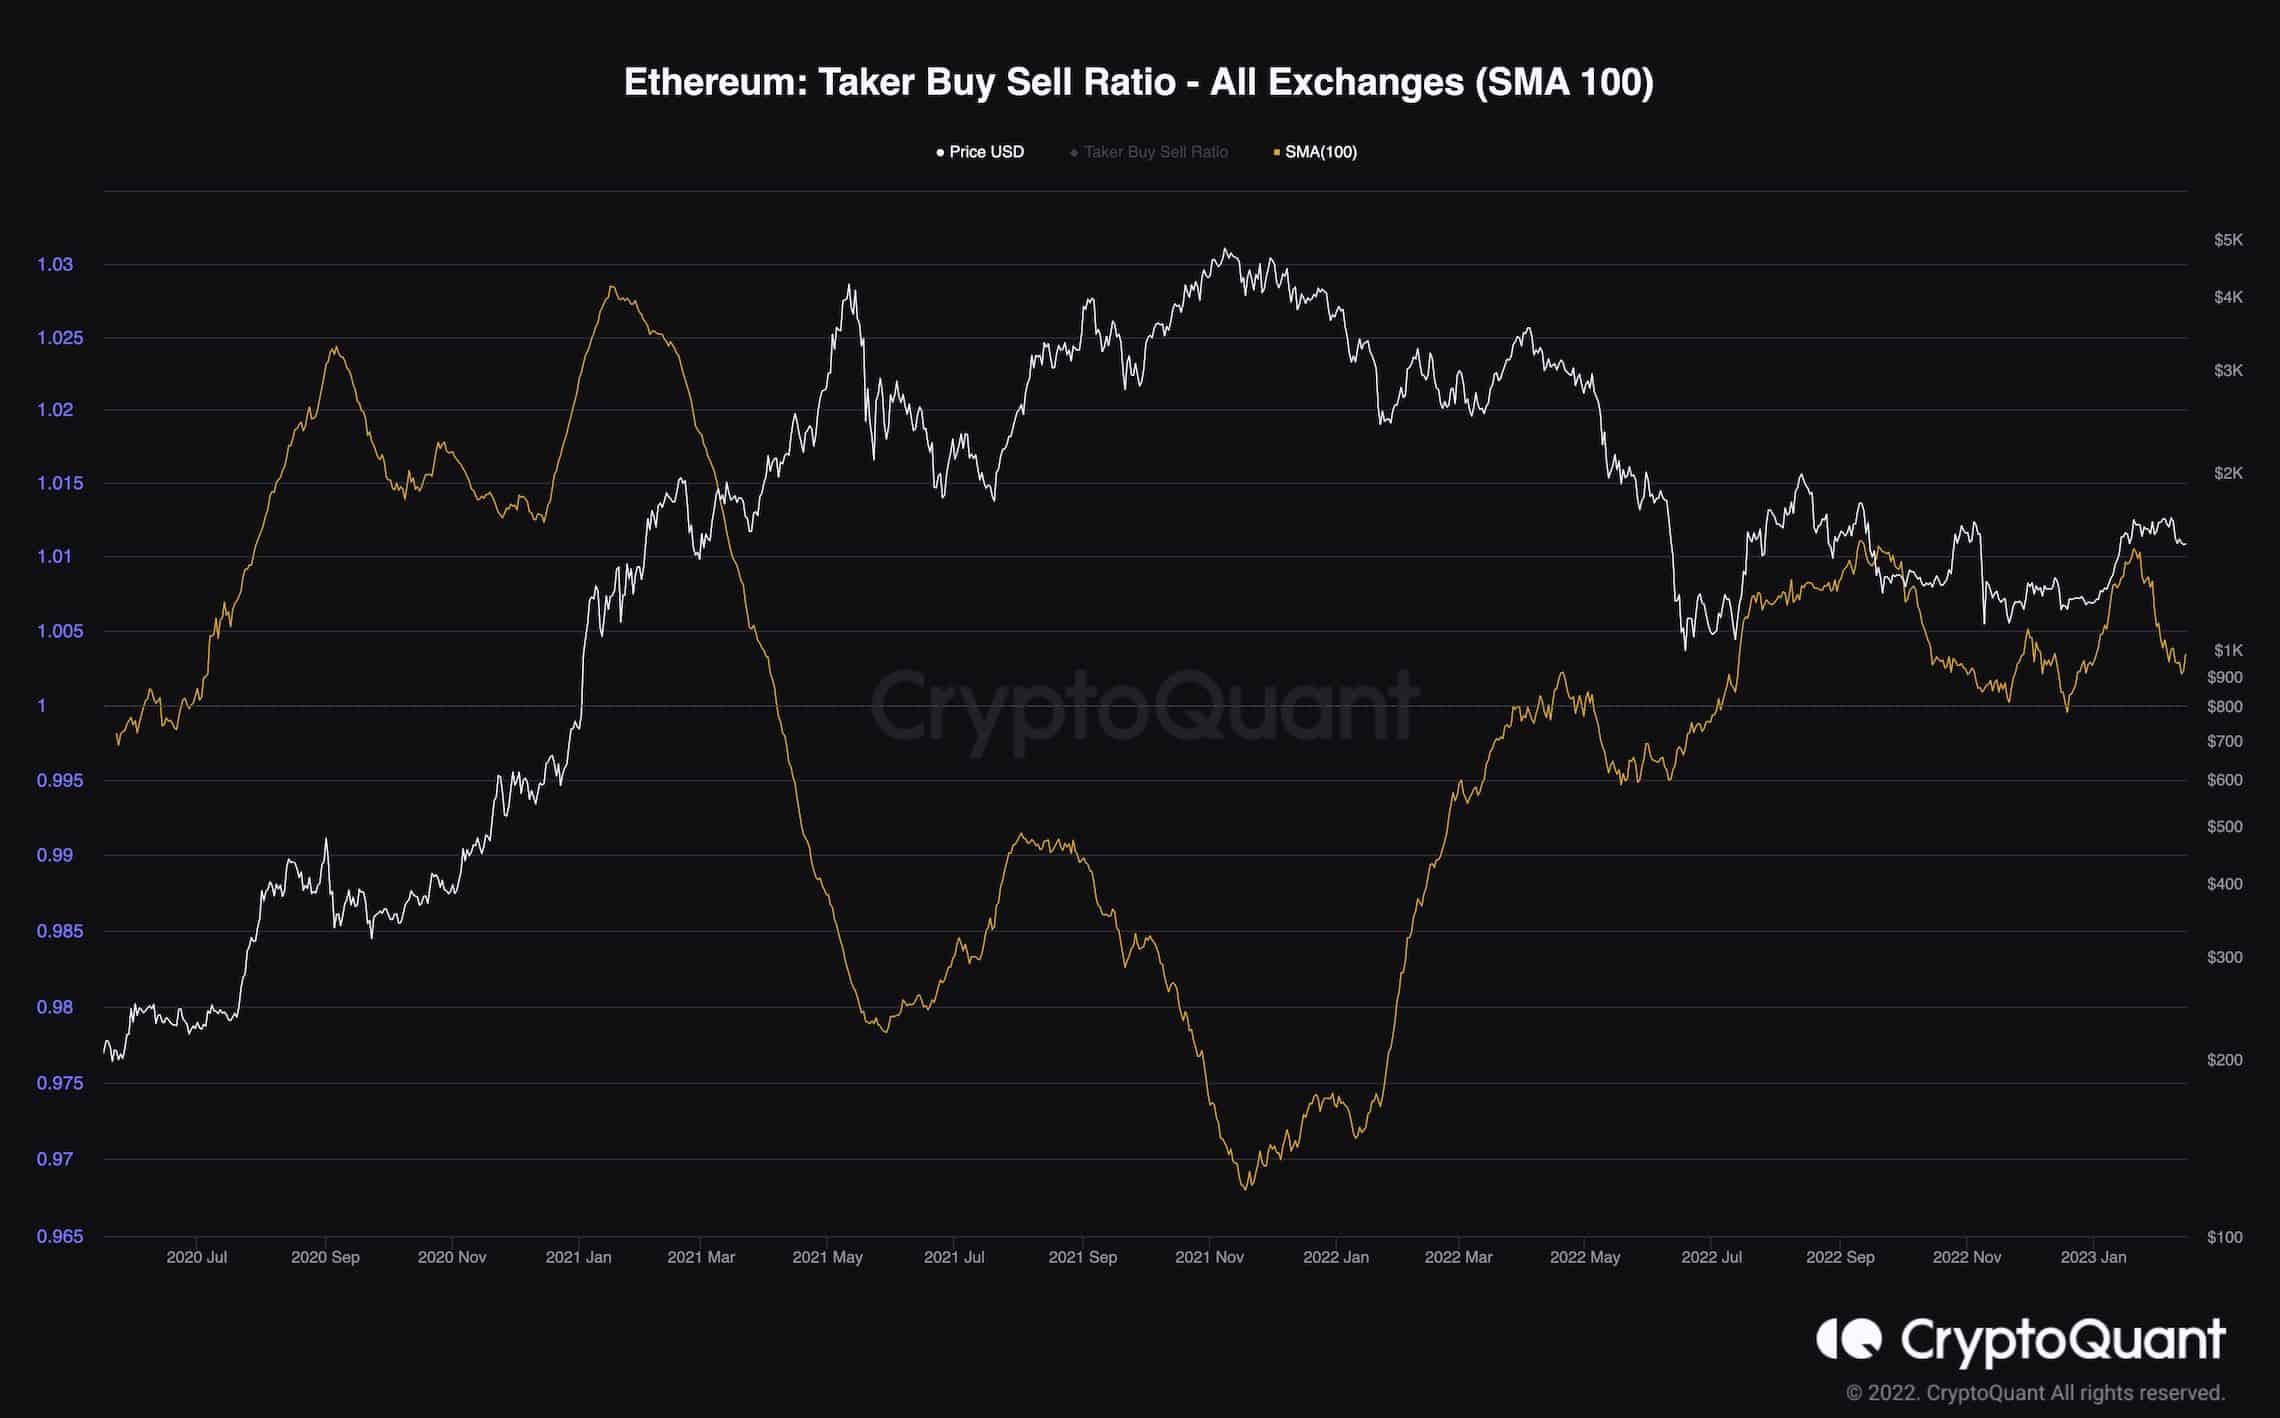
ອັດຕາສ່ວນການຊື້ Ethereum Taker (SMA 100)
The futures market has been one of the most significant factors in determining the short-term price action of ETH during recent years. Therefore, analyzing its sentiment could offer useful insights.
This chart demonstrates the Taker Buy Sell Ratio metric with a 100-day moving average applied for better visualization. This metric shows whether the bulls or bears are executing their orders more aggressively. Values above 1 indicate bullish market sentiment, while values below 1 indicate selling pressure in the futures market.
While this metric has been holding above 1 for quite some time, it has been on the decline recently. This indicates that the buying pressure is decreasing, and in case it drops below 1, the market would likely drop to a new low, as sellers would dominate once more.
This metric should be monitored carefully in the coming weeks to determine whether the recent rally was really the beginning of a new bull market or just another bull trap.
Binance ຟຣີ $100 (ສະເພາະ): ໃຊ້ລິ້ງນີ້ ເພື່ອລົງທະບຽນ ແລະຮັບ $100 ຟຣີ ແລະຄ່າທຳນຽມສ່ວນຫຼຸດ 10% ໃນ Binance Futures ໃນເດືອນທຳອິດ (ຂໍ້ກໍານົດ).
ຂໍ້ສະ ເໜີ ພິເສດ PrimeXBT: ໃຊ້ລິ້ງນີ້ ເພື່ອລົງທະບຽນ ແລະໃສ່ລະຫັດ POTATO50 ເພື່ອຮັບສູງເຖິງ $7,000 ໃນເງິນຝາກຂອງທ່ານ.
ການປະຕິເສດ: ຂໍ້ມູນທີ່ພົບໃນ CryptoPotato ແມ່ນບັນດານັກຂຽນທີ່ອ້າງອີງ. ມັນບໍ່ໄດ້ສະແດງຄວາມຄິດເຫັນຂອງ CryptoPotato ກ່ຽວກັບວ່າຈະຊື້, ຂາຍ, ຫລືຖືການລົງທືນໃດໆ. ທ່ານໄດ້ຖືກແນະ ນຳ ໃຫ້ເຮັດການຄົ້ນຄວ້າຂອງທ່ານເອງກ່ອນທີ່ຈະຕັດສິນໃຈລົງທຶນໃດໆ. ໃຊ້ຂໍ້ມູນທີ່ສະ ໜອງ ໃຫ້ໃນຄວາມສ່ຽງຂອງທ່ານເອງ. ເບິ່ງປະຕິເສດ ສຳ ລັບຂໍ້ມູນເພີ່ມເຕີມ.
ຕາຕະລາງ Cryptocurrency ໂດຍ TradingView.
Source: https://cryptopotato.com/heres-the-next-support-for-eth-if-1500-fails-ethereum-price-analysis/