As another trading week plays out let’s take a tally of the market.
Most major equity indexes closed near their intraday highs Thursday as three of the charts managed to close above their near-term downtrend lines. Cumulative market breadth saw some minor improvement as well.
While the McClellan OB/OS Oscillators remain oversold, corporate insiders continue to intensify their selling activity. And the S&P 500’s forward valuation remains at a significant premium to ballpark fair value. This is in conjunction with the 10-year Treasury Yield in an uptrend.
All of this is putting enough weight on the scales to suggest remaining cautious regarding equities.
Now let’s dig a little deeper…
Some Index Charts Turn Neutral
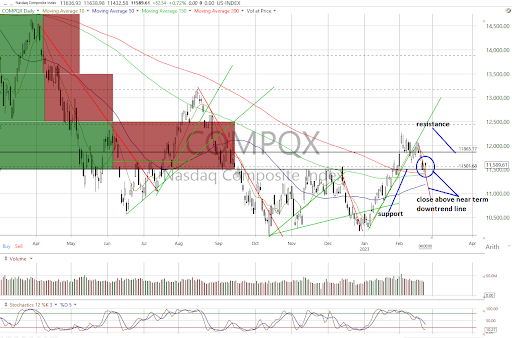

Chart Source: Worden
On the charts, the major equity indexes closed higher Thursday with positive NYSE and Nasdaq internals as both saw trading volumes decline from the previous session.
The majority closed near their session highs that allowed the S&P 500, Nasdaq Composite (see above) and Nasdaq 100 to close above their near-term downtrend lines, turning said trends to neutral from bearish. However, the rest are still in negative trends.
Cumulative market breadth saw some minor improvement as the All Exchange and NYSE advance/decline lines turned neutral from bearish with the Nasdaq’s staying negative.
Stochastic levels are oversold on all the charts but have yet to generate bullish crossover signals.
Increased Insider Selling
On the data dashboard, the 1-Day McClellan Overbought/Oversold Oscillators are still oversold but less so (All Exchange: -60.3 NYSE: -68.25 Nasdaq: -53.93). The bounce potential has weakened.
The percentage of S&P 500 issues trading above their 50-day moving average (contrarian indicator) rose to 50% and remains on a neutral signal.
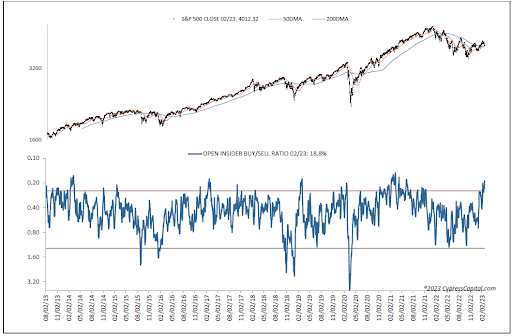
The Open Insider Buy/Sell Ratio continues to wave a large yellow flag, in our view, as insiders continued to intensify their recent selling activity to a bearish 18.8. They have been very active sellers over the past several sessions in the face of a declining market. We would much prefer to see them as buyers of weakness, but such action has yet to appear.
The Open Insider buy/sell ratio is 18.8 % (bearish)
The detrended Rydex Ratio (contrarian indicator) slipped to +0.03 and is neutral.
This week’s AAII Bear/Bull Ratio (contrarian indicator) dropped to 0.87 as bearish sentiment declined and remains neutral.
The Investors Intelligence Bear/Bull Ratio (contrary indicator) is neutral at 59.4.
The S&P’s Valuation Is Stretched
Valuation continues to be troubling.
The forward 12-month consensus earnings estimates from Bloomberg for the S&P 500 has dropped to $220.69 per share and continues to be a problem as its P/E multiple of 18.2x remains at a significant premium to the “rule of 20” ballpark fair value of 16.1x. We reiterate that valuation, in our opinion, continues to leave little margin for error for equities.
ຜົນຜະລິດຕໍ່ໄປຂອງ S&P ແມ່ນ 5.55%.
The 10-Year Treasury yield closed lower at 3.88%. It is in a short-term uptrend with support at 3.76% and resistance at 4.01%, by our analysis.
Our Market Outlook
While the charts are currently in mostly positive trends, increasing insider selling and market valuation continue to suggest caution remains appropriate before stepping in.
ໄດ້ຮັບການແຈ້ງເຕືອນທາງອີເມວທຸກໆຄັ້ງທີ່ຂ້ອຍຂຽນບົດຄວາມ ສຳ ລັບເງິນທີ່ແທ້ຈິງ. ກົດປຸ່ມ“ + ຕິດຕາມ” ຕໍ່ກັບເສັ້ນທາງຂອງຂ້ອຍຕໍ່ບົດຄວາມນີ້.
Source: https://realmoney.thestreet.com/markets/increased-insider-selling-and-the-s-p-s-valuation-are-waving-big-yellow-flags-16116800?puc=yahoo&cm_ven=YAHOO&yptr=yahoo