- Strong positive momentum can be seen in the price of the RNDR token as it moved from the supply zone to the demand zone.
- RNDR token price as it bounced off the demand zone has formed a rounding bottom pattern on a daily time frame.
- The RNDR/BTC pair is now trading at 0.00004781, up 3.28% over the previous day.
According to price action, the RNDR token price is hovering around the supply zone after experiencing a strong bullish momentum from the overall cryptocurrency market. The token price is currently forming a reversal chart pattern, indicating further bullish movement.
RNDR token price races through eh short term supply zones
On a daily time frame, the RNDR token price is currently trading above the demand zone and above the important Moving Averages. During the recent bullish momentum, the token price broke the important MAs and has been in an uptrend since. The token price is rising above the MAs after finding support during the pullback a. The token price is currently forming a higher high and higher low price structure.
The RNDR token price is trading at the upper band of the Bollinger band indicator after bouncing off the lower band. Although, the token price is yet to cross the upset band of the Bollinger band indicator. Volumes have increased after the token price rose steeply indicating strong volatility in the upcoming g trading days therefore investors should remain cautious and wait for a proper breakout for a further uptrend move.
The RNDR token price is forming a rounding bottom pattern on a daily time frame
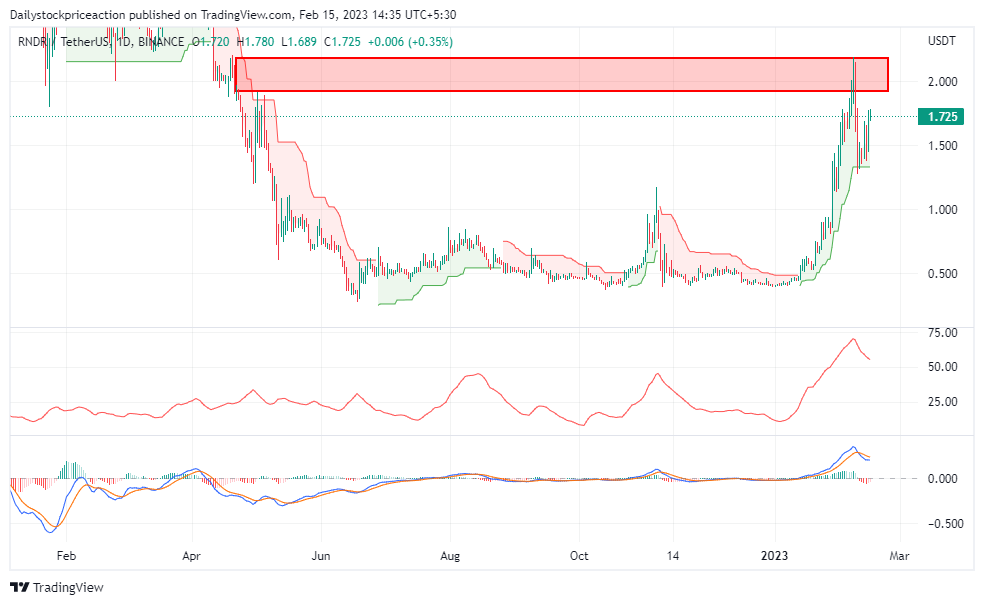
The price of the RNDR token is forming a bullish chart pattern. The token price was in the demand zone prior to the current movement, and a recent bullish movement has pushed the price as well as the ADX curve upwards. The ADX curve is currently hovering at 50512, just above the 25 mark. The ADX curve has shifted to indicate the possibility of a break in the current price structure, which could result in the formation of a bullish price structure.
The RNDR token price has been on an upward trend, as shown by the MACD indicator. On the upside, the blue line crossed the orange line, indicating bullish momentum in the coming trading days. When the token price breaks through the supply zone, the MACD line widens, supporting the trend. Investors should exercise caution because the token price can behave erratically until it breaks the supply zone consolidation.
The RNDR token price was facing a strong rejection from the super trend sell line which was acting as a strong supply zone, but recent movement broke it and now the super trend indicator has triggered a positive signal indicating. Moving upward the token price can be seen resting at the super trend buy line, which can act as a strong demand zone.
ສະຫຼຸບ: The RNDR token price is bullish as per the price action and the same is shown by the technical parameters. However, the token price is yet to cross the supply zone, investors should wait for proper price action and then act accordingly.
ສະຫນັບສະຫນູນ: $ 1.2 ແລະ $ 1.3
ຄວາມຕ້ານທານ: $ 1.9 ແລະ $ 2.1
ຂໍ້ສັງເກດ
ທັດສະນະແລະຄວາມຄິດເຫັນທີ່ຂຽນໂດຍຜູ້ຂຽນ, ຫຼືຄົນທີ່ມີຊື່ໃນບົດຄວາມນີ້, ແມ່ນສໍາລັບຄວາມຄິດທີ່ເປັນຂໍ້ມູນເທົ່ານັ້ນ, ແລະພວກເຂົາບໍ່ໄດ້ສ້າງຕັ້ງທາງດ້ານການເງິນ, ການລົງທຶນ, ຫຼືຄໍາແນະນໍາອື່ນໆ. ການລົງທຶນໃນຫຼືການຊື້ຂາຍຊັບສິນ crypto ມາພ້ອມກັບຄວາມສ່ຽງຂອງການສູນເສຍທາງດ້ານການເງິນ.
Andrew ເປັນນັກພັດທະນາ blockchain ຜູ້ທີ່ພັດທະນາຄວາມສົນໃຈຂອງລາວໃນ cryptocurrencies ໃນຂະນະທີ່ລາວຮຽນຈົບ. ລາວເປັນນັກສັງເກດການຢ່າງກະຕືລືລົ້ນໃນລາຍລະອຽດແລະແບ່ງປັນຄວາມມັກຂອງລາວໃນການຂຽນພ້ອມກັບການເປັນນັກພັດທະນາ. ຄວາມຮູ້ດ້ານຫລັງຂອງລາວກ່ຽວກັບ blockchain ຊ່ວຍໃຫ້ລາວມີທັດສະນະທີ່ເປັນເອກະລັກໃນການຂຽນຂອງລາວ
Source: https://www.thecoinrepublic.com/2023/02/15/rndr-token-price-analysis-token-price-retraces-for-a-big-move/